Everything Tombstack does
Tombstack is crash, bug and telemetry monitoring for game studios. You install an SDK, and from that point on crashes, handled exceptions, unclean shutdowns, player bug reports, breadcrumbs, analytics events, custom metrics and session heartbeats flow into a dashboard — plus an MCP server, so an AI can triage them for you.
That sentence has been on the homepage for a while. This post is the long version: what each of those words actually buys you, where the edges are, and what is still on the roadmap. If you only read one article about the platform, read this one.
1. What the SDK captures
The design goal for the SDK was blunt: after one line of setup, a studio should never have to think about capture again. No manual try/catch plumbing, no remembering to attach context, no separate call to log a crash.
using AnkleBreaker.Tombstack;// That is the install. Everything below is now automatic.Tombstack.Init("tmb_…", "https://tombstack.com");
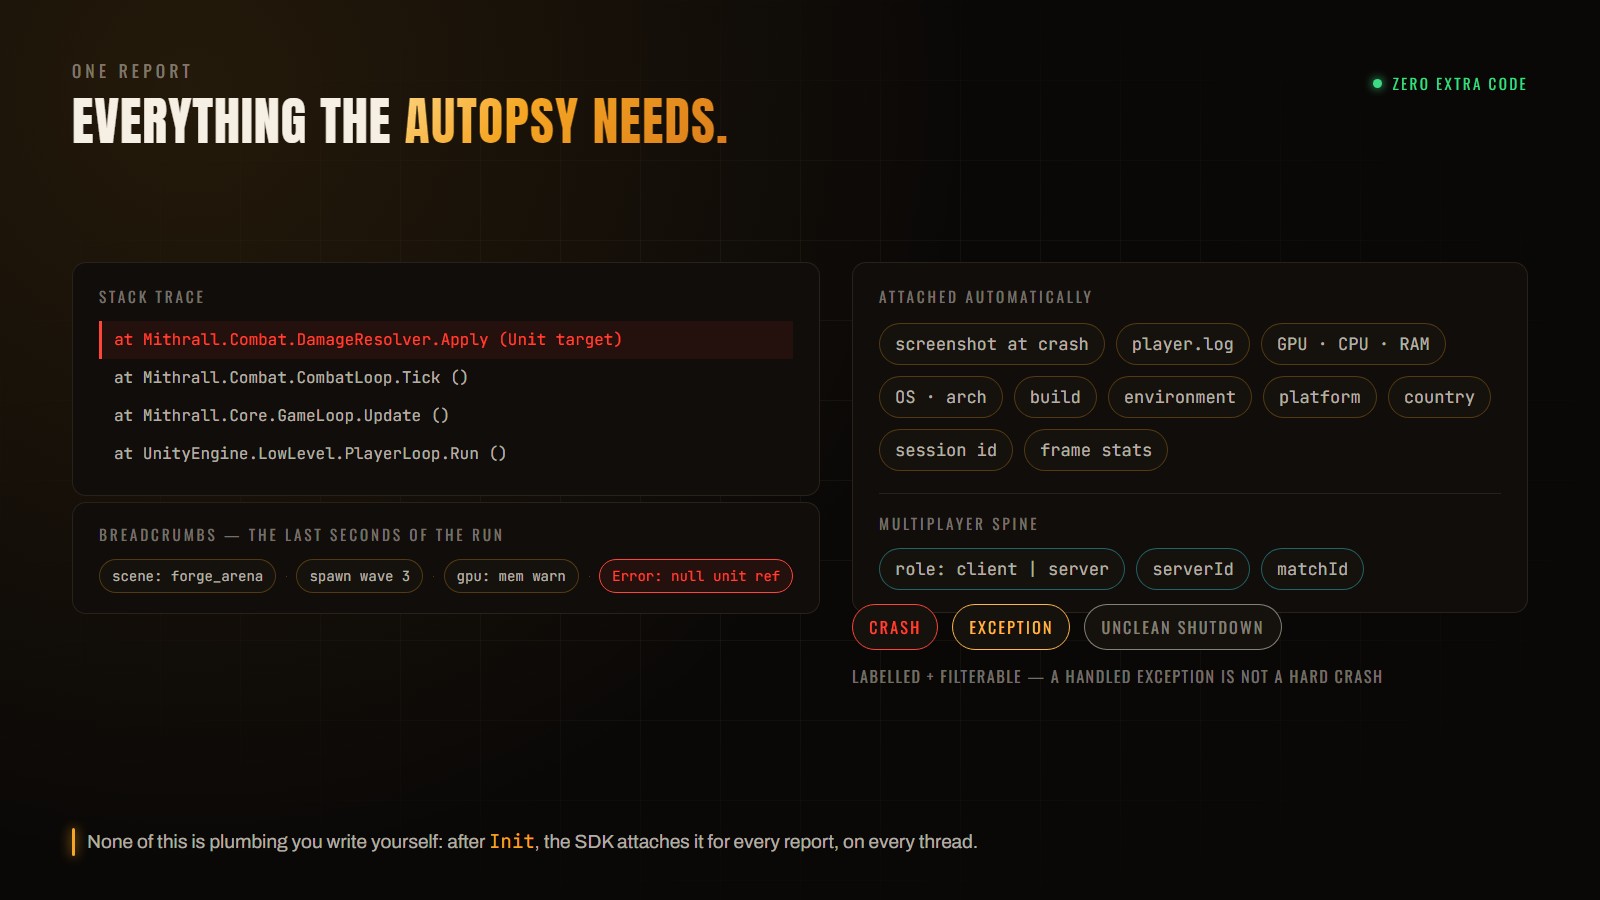
From that call onward the SDK hooks unhandled exceptions on every thread — not just the main thread — classifies what it caught, attaches the context, and ships it. If the process dies too hard to send anything, the report is written to disk and uploaded on the next launch.
Three kinds, not one bucket
Most tools call everything a “crash”. That flattens three very different events, so Tombstack labels them separately and lets you filter on the label:
- Crash — the process died. A native fault, a hard abort.
- Exception — an unhandled managed exception the runtime survived, or survived long enough to report.
- Unclean shutdown — no crash arrived, but the session never ended properly either. The player's device was killed, ran out of memory, or the app was force-stopped.
That third category is the one studios usually cannot see at all, and it is often where the worst problems hide — a memory-pressure kill on mobile produces no stack trace, so a tool that only records crashes reports perfect health. On Android the SDK reads the real OS exit reason, so an unclean shutdown can be attributed rather than guessed at.
The context that comes with it
A stack trace tells you what broke. The attached context tells you why it broke right then. Every report carries the breadcrumb trail leading up to it, a screenshot taken at the moment of failure, the player's log, the device specification (GPU, CPU, memory, OS, architecture), the build, the deployment environment, the platform, and the session it belonged to.
Session heartbeats add frame health on top — including a short intra-beat FPS series, so a report can be read against what performance actually looked like in the seconds before the failure rather than an average over the whole session.
Logs from sessions that already ended
The SDK keeps the logs of the last few launches on the player's device, keyed per launch. That matters because the interesting question usually arrives late: a player reports a problem on Tuesday about a session on Sunday. Because the log is still there, you can request it after the fact instead of asking them to reproduce the bug.
2. How a crash becomes a triaged issue
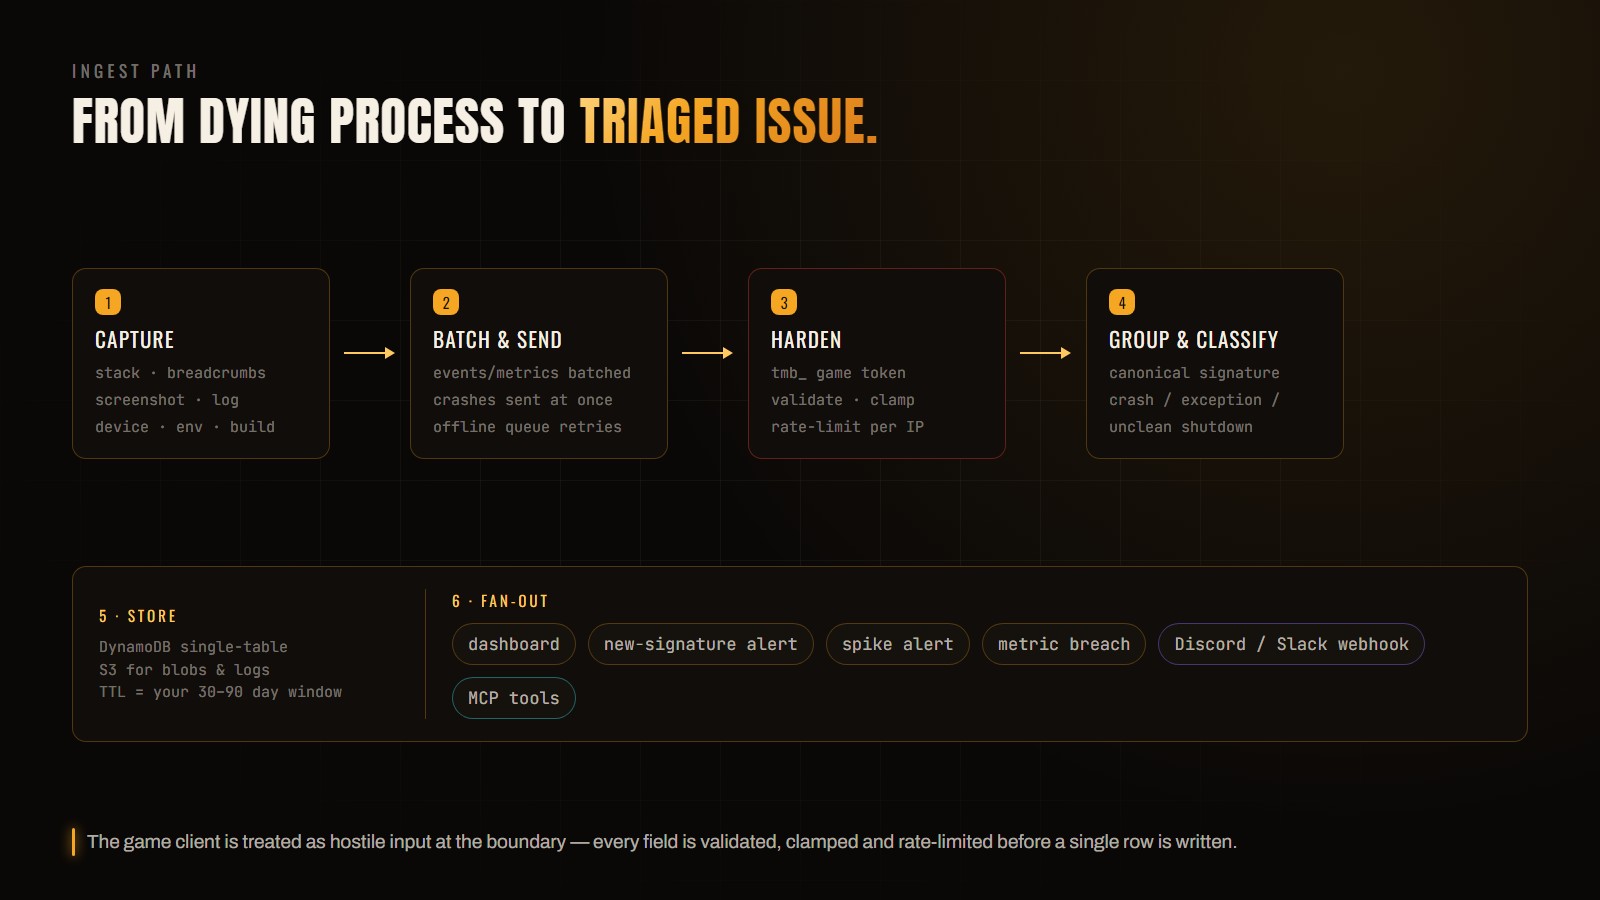
Between the game and the dashboard there is a pipeline whose job is to be fast, cheap and paranoid — in that order.
Batched, so your game does not pay for telemetry
Analytics events and custom metrics are buffered and sent in batches rather than one HTTP request per event, with each item keeping its own timestamp so the ordering survives the trip. The buffers are bounded and drop oldest-first: if the network is gone, telemetry degrades instead of growing without limit. Crashes are the deliberate exception — they are never held back for a batch window.
The client is treated as hostile
A shipped game is an untrusted client. Anyone can pull the token out of a build and start posting whatever they like. So ingestion authenticates with a per-game token that can only write, validates every field, clamps sizes and ranges, and rate-limits per IP. A malformed or oversized payload is rejected at the boundary, before it can reach storage.
Grouping
Reports are grouped into signatures on the shape of the failure, so ten thousand occurrences of one bug are one issue with a count — not ten thousand rows to scroll. Each signature carries first-seen and last-seen, affected-user counts, and the breakdown by build, platform and environment, which is what turns “we have crashes” into “we have this crash, on this build, mostly on this platform, since Tuesday”.
3. Multiplayer: linking a dead server to the players on it
This is the part built specifically because we make multiplayer games, and it is the piece most crash tools simply do not have. In a session-based multiplayer game the interesting failure is rarely confined to one process. A server dies and forty players get dropped. One client desyncs and you need to know what the server saw.
Every event the SDK sends carries three correlation fields: whether it came from a client or a dedicated server, the server identity, and the match identity. Dedicated servers register their own boot sessions. Nothing about this requires correlation code in your game — the SDK stamps the fields, and the graph assembles itself.
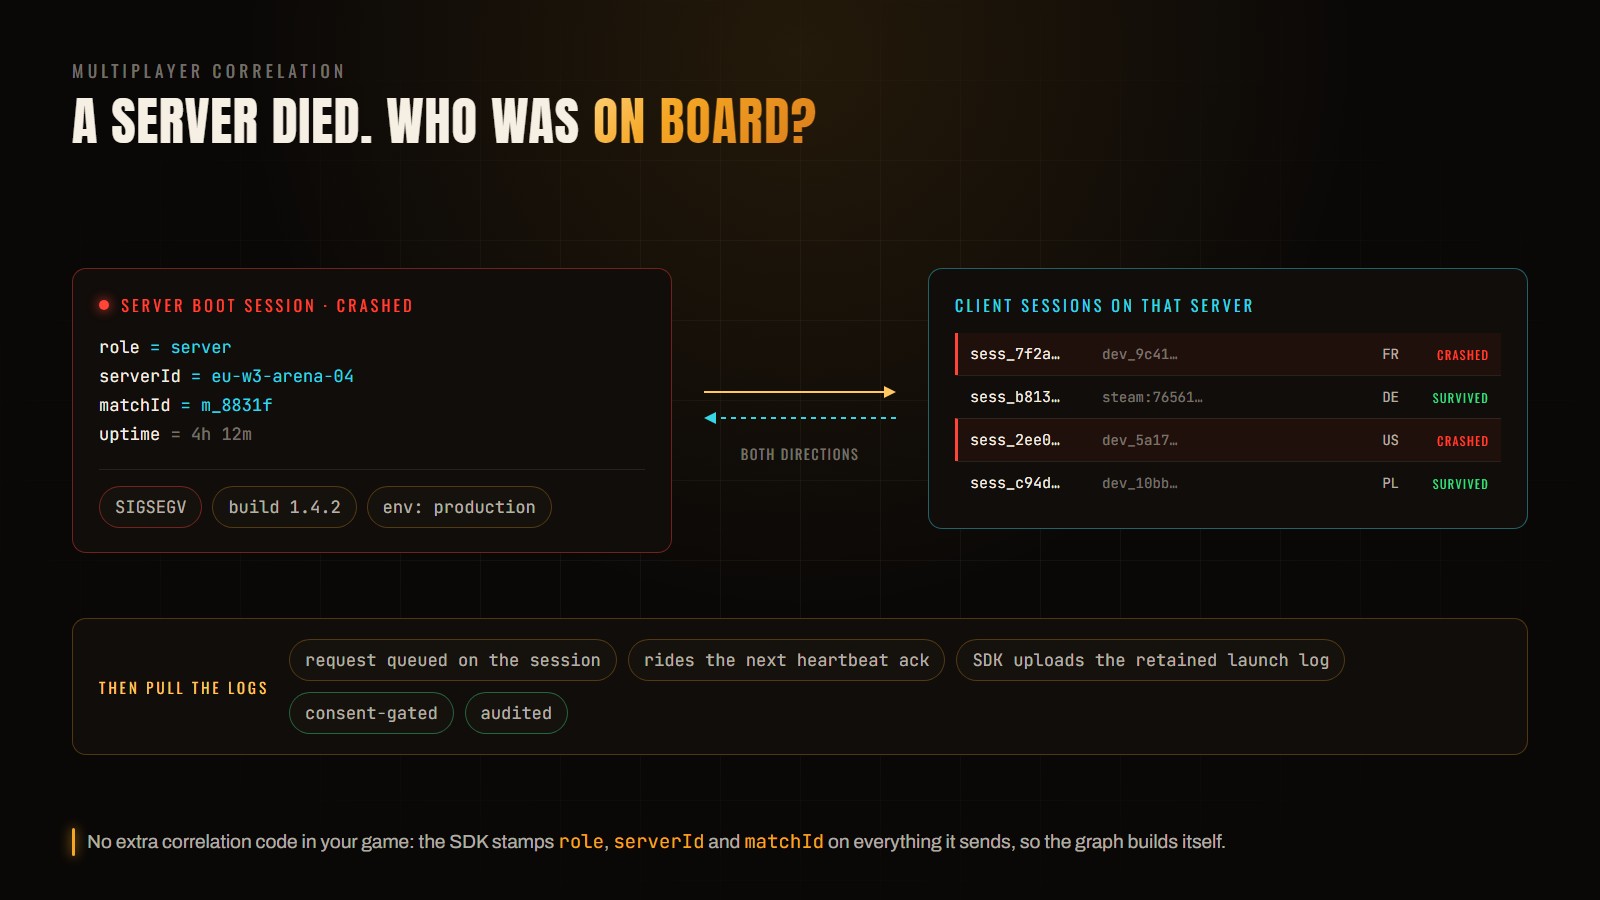
So the two questions you actually ask during an incident both have answers. A server crashed — who was on board, and which of them crashed too? A player crashed mid-match — what server were they on, and was anyone else affected at the same moment?
Pulling logs from the players who were there
Knowing who was connected is half of it. The other half is getting their logs. You can queue a log request against those sessions; the request rides the acknowledgement of the next session heartbeat, and the SDK uploads the launch log it retained. It is consent-gated and every request is recorded in an audit trail — pulling a player's log is a deliberate, logged action, not an ambient capability.
Alongside that there is a live view: which sessions are running right now, paginated, so during a launch you are watching the actual population rather than a five-minute-old aggregate.
4. Analytics that answer “why did they leave?”
Crash monitoring tells you the game broke. Analytics tells you the game was boring, or confusing, or that the tutorial has a wall in it. Tombstack does both in one game, on the same session and identity model, which is the entire point — a drop-off and a crash spike are usually the same event seen from two angles.
Funnels that explain their drop-off
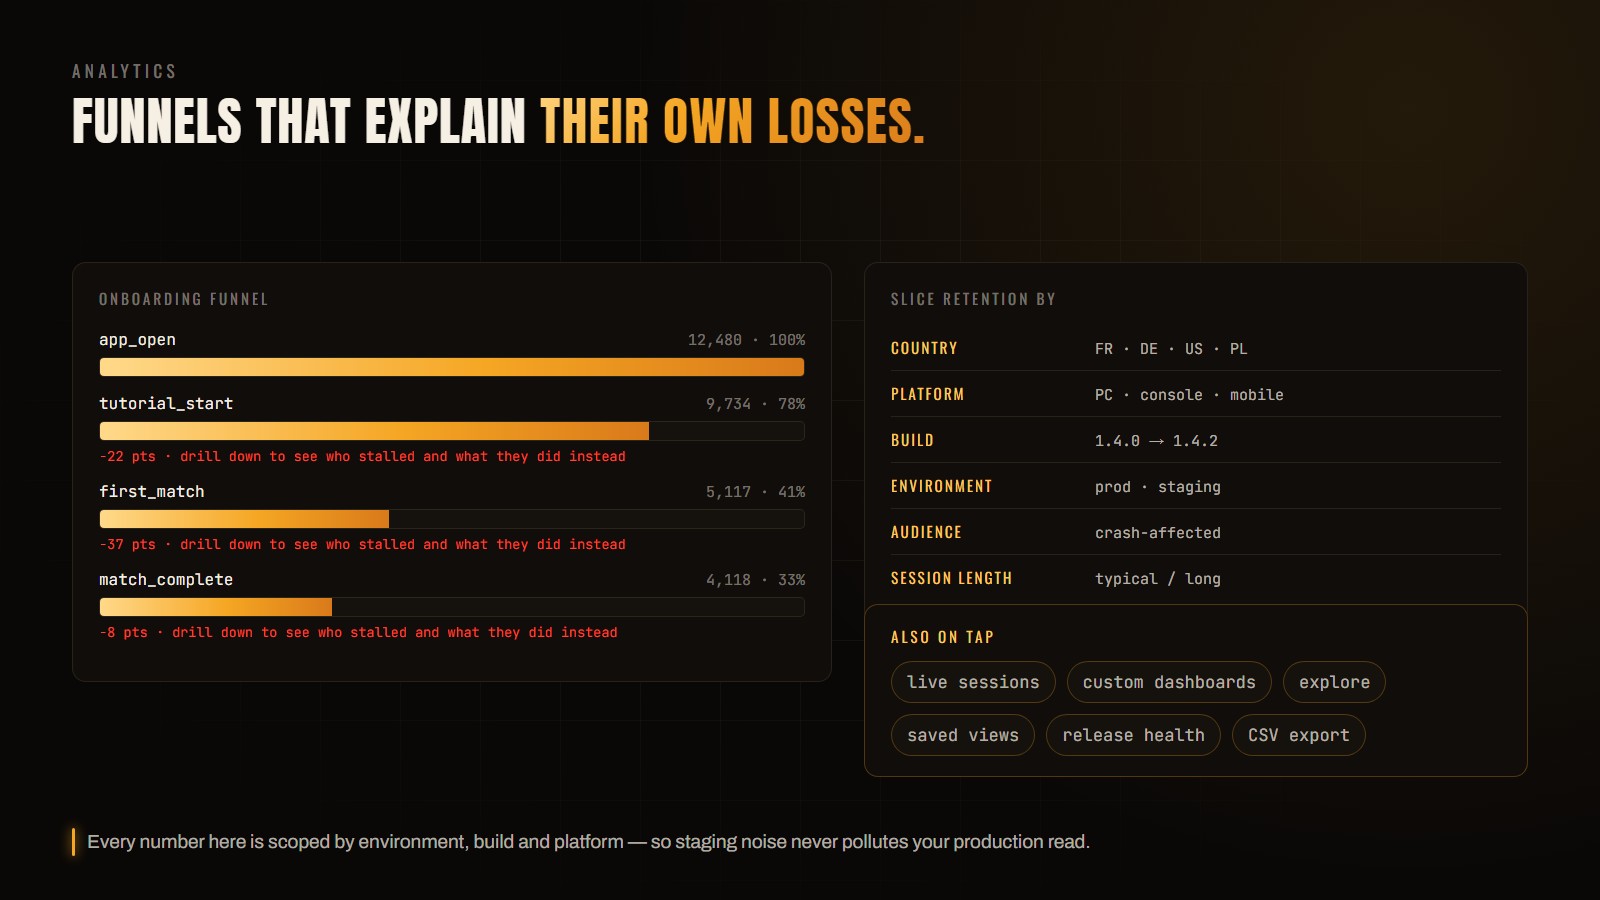
A funnel that tells you 41% reached the first match is only mildly useful. The follow-up question — which players stalled, and what did they do instead? — is the one that changes what you build. So each step's loss can be drilled into: you get the players who stalled there, what they did next instead of advancing, and a link straight into the session so you can read the sequence yourself.
Funnels can also be scoped to an audience — for example, only players affected by a crash — which is how you find out whether a conversion problem is a design problem or a stability problem wearing a design problem's clothes.
Retention, cohorted properly
Retention is sliced by first-seen cohort across several dimensions: country, platform, build, environment, audience, typical session length. Two rules are enforced throughout, because both are easy to get wrong and both produce flattering nonsense: cohorts are keyed on when a player was first seen rather than when the current window opened, and a cohort is only shown once its denominator is mature enough to mean something.
The rest of the analytics surface
- Custom dashboards — widgets you arrange per game, including time series, breakdowns, heatmaps and top-event lists.
- Explore — an ad-hoc query builder for when a dashboard does not have the cut you need.
- Saved views — a filter set you keep, so the question you ask every morning is one click.
- Release health — per-build health so a regression shows up as a build comparison rather than a vibe.
- Environment scoping — staging noise never lands in your production numbers.
- CSV export — for the analysis you want to do somewhere else.
5. Alerting: knowing before the reviews do
A dashboard only helps when someone is looking at it, and nobody is looking at 3am. Tombstack watches on a schedule and pushes when something changes: a signature that has never been seen before, a crash rate spiking against its own baseline, or a custom metric breaching a threshold you set.
Alerts go to a webhook, formatted for where they land — a rich embed on Discord, Block Kit on Slack, or a structured payload if you are wiring it into something of your own. The platform is detected from the URL, so you paste the webhook and get the right format without configuring anything. Alerts can be scoped per game rather than only per studio.
6. Getting in: four surfaces
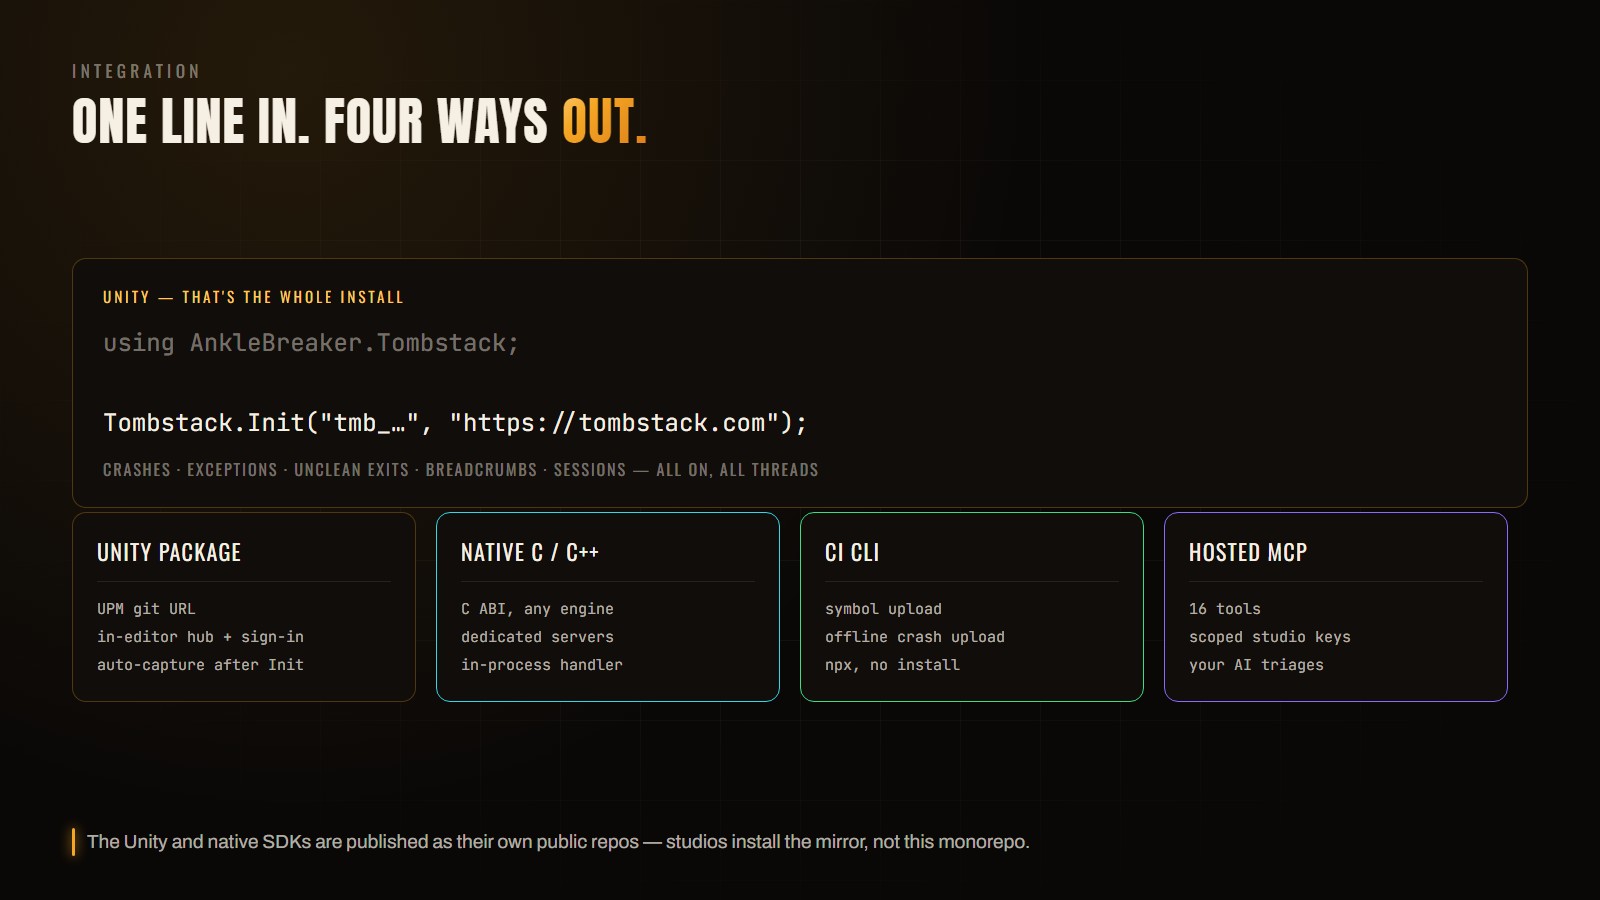
- Unity package — installed over UPM from a public mirror repo, with an in-editor hub that signs in to your Tombstack account so you can see your game's state without leaving the editor.
- Native C/C++ SDK — a C ABI you can link into any engine or a dedicated server binary. It includes an in-process crash handler that captures the top frames at crash time and reports on the next launch.
- CI CLI — run with npx, no install: upload symbols as part of your build, and push offline crash reports. Symbol upload needs a studio-scoped key, since per-game tokens are write-only ingest credentials.
- Hosted MCP server — 35 tools over your data so an AI assistant can do the first pass of triage *and* the investigation after it: save a funnel, run it, see the exact step players fall out of, build an audience from that, and ask what quitters did last. It also reaches the live-ops surface — p50/p95/p99 for any metric your game reports, the match list and a single match's full timeline, which players were connected to a server when it died, and the minidump download that is the only route to frames for a native crash. Release health is there too, with the session denominator under every per-build rate and the product's own refusal to grade a build it has too little data on — so an assistant cannot rank your builds by raw crash count and crown the one nobody is playing. Funnels it creates land on your Funnels dashboard. Everything it writes is a definition — deleting one removes a saved question, never your telemetry. Keys are minted by the studio and scoped either to one game or all of them; it is a paid add-on.
The MCP piece is worth dwelling on, because it changes the shape of triage. Instead of you reading a crash summary, an assistant can pull the summary, drill into the individual crashes, fetch a bug report with its breadcrumb trail and screenshot, check release health, and come back with a hypothesis. The tools are read-oriented and scoped to the key, so what the AI can see is exactly what you granted.
7. Where your data lives, and for how long
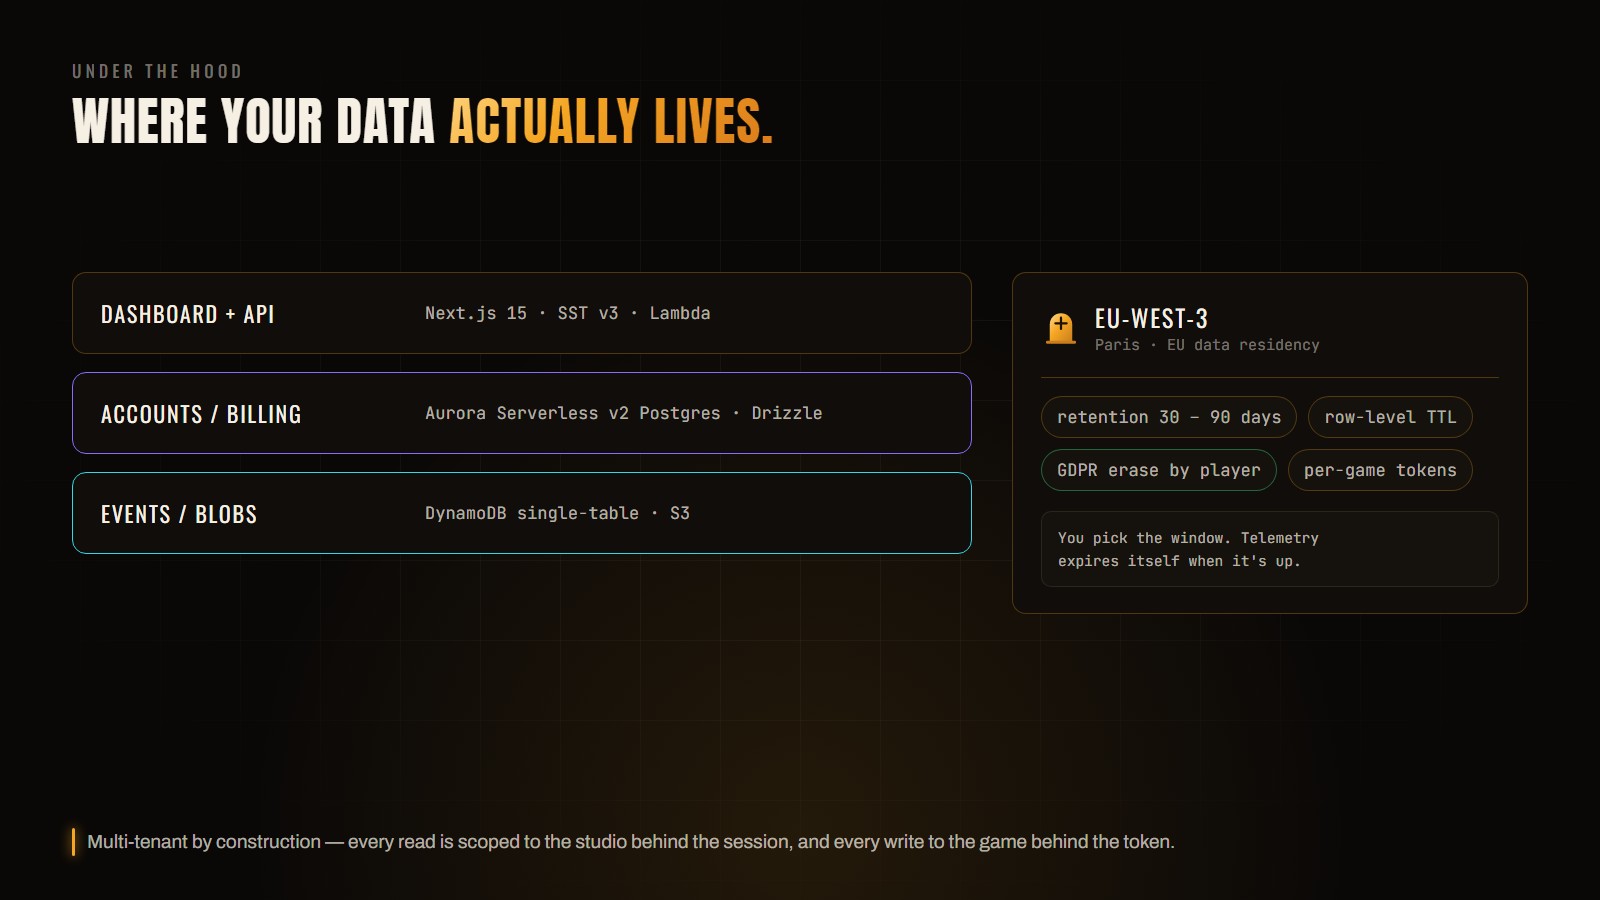
Everything runs in eu-west-3 (Paris). Accounts and billing live in Postgres; events and blobs live in a DynamoDB single table plus S3. You choose the telemetry retention window between 30 and 90 days, and it is enforced as a row-level expiry at write time — data ages out on its own rather than waiting for a cleanup job. The free tier is fixed at 30 days.
Because a player identity can change over a session's life — a provisional device identity upgrading to a real account — GDPR erasure follows those links rather than deleting only the row you searched for. The known limits of that are written down honestly in the GDPR notes rather than glossed over.
8. What it costs
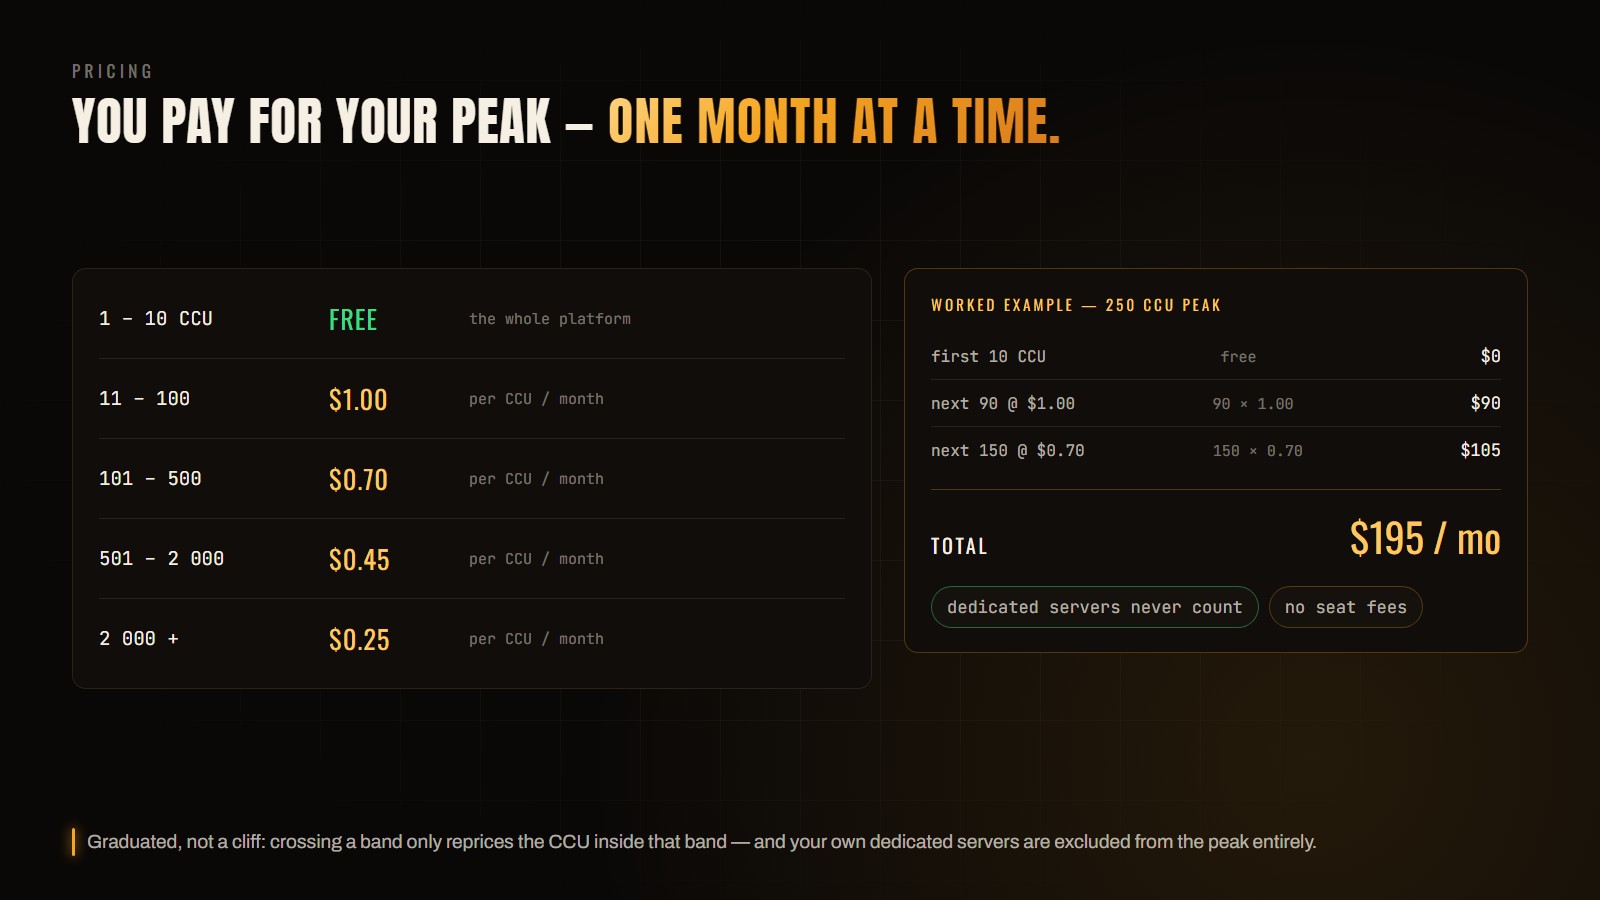
Billing is on monthly peak concurrent players, graduated across bands, and free up to 10 CCU. Graduated matters: crossing a band reprices only the players inside that band, so there is no cliff where one extra concurrent player costs you a step change. There are no per-seat fees — invite your whole team.
Two details studios ask about. Your own dedicated servers do not count toward the peak; billing them as players would be charging you for your own infrastructure. And signup takes no card at all — you add one from the billing page when you choose to. If your peak crosses the free tier we email you first and keep ingesting; a card on file lets that turn into a subscription automatically instead of waiting on you, and without one you get reminders rather than a silent cut-off.
9. What is not done yet
A capabilities post that only lists wins is marketing. Three things are genuinely still in progress, and it is better that you hear it here than discover it later:
- Full native stack unwinding. The native SDK's in-process handler captures the top frames today. Complete Breakpad-style unwinding is the tracked follow-up.
- Server-side symbolication. Symbol upload works and symbols are stored; resolving native minidumps into readable traces server-side is next.
- Unreal. There is a Unity package and a C/C++ SDK you can link into Unreal, but no first-class Unreal plugin yet.
The platform is live, billing real customers, and dogfooded on our own Unity game — which is also why the roadmap above is short and specific rather than aspirational.
If you want to try it, the free tier is the whole platform up to 10 peak CCU — not a crippled trial. Install the SDK, ship a build, and see what your game has been doing when you were not looking.